

Researchers Identify Nine Unique Types of Precipitation
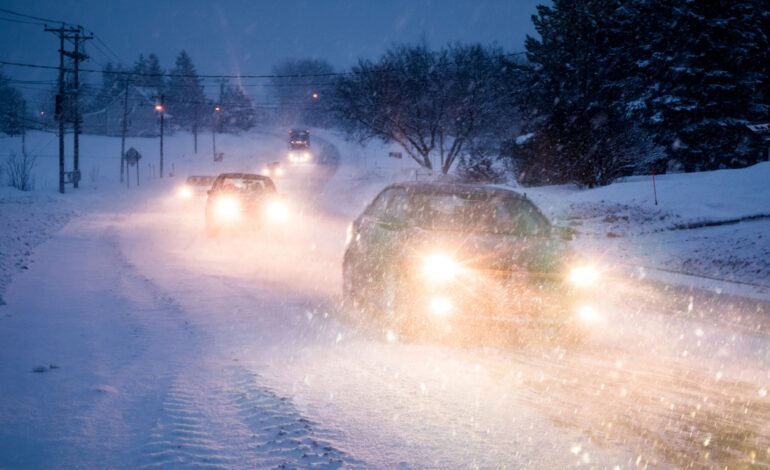
Meteorologists and climate scientists have expanded the traditional understanding of precipitation from three common types—rain, snow, and sleet—to a comprehensive classification that includes nine distinct categories. This transformation comes after a decade-long research project involving engineers from NASA and the University of Michigan, which meticulously analyzed weather data to enhance forecasting accuracy. Their findings, detailed in a study published in the journal Science Advances, aim to improve public safety through better weather predictions.
The team utilized advanced machine learning techniques to process vast amounts of weather data. Notably, they discovered that precipitation can occur within a temperature range of 26.6 to 41 degrees Fahrenheit, challenging the conventional belief that snow only falls when temperatures are below freezing. This insight underscores the complexities of weather prediction, revealing why established models often struggle with accuracy. While satellite systems excel at tracking cloud movement, they are less effective in monitoring ground-level conditions.
To address these challenges, NASA developed the Precipitation Imaging Package (PIP), a sophisticated camera system designed to capture detailed precipitation data. Installed at seven strategic locations across the United States, Canada, and Europe, PIP records precipitation events using high-speed cameras and measures particle characteristics with a device known as a disdrometer. Over the course of nine years, researchers collected around 1.5 million small-scale particle measurements, along with critical surface weather station data, including temperature, dew point, relative humidity, pressure, and wind speed.
The complexity of this data necessitated the use of a statistical technique called dimensionality reduction to identify patterns. Researchers created two machine learning models: a conventional linear model and a nonlinear model that accounted for more intricate relationships between particles. The nonlinear model significantly outperformed its counterpart, reducing ambiguity by 36 percent and aligning closely with radar data. This led to the development of the Uniform Manifold Approximation and Projection system, or UMAP, which simplifies data complexity and highlights three primary factors influencing precipitation: particle characteristics, intensity, and phase.
The study classifies precipitation into nine categories, which include:
– Drizzle: light, steady rainfall
– Heavy rainfall: intense rainfall with numerous small drops
– Light rain-to-mix transition: light sleet with dense ice pellets
– Heavy rain-to-mix transition: intense sleet with dense ice pellets
– Light mixed-phase: a low volume of slushy, partially frozen particles
– Heavy mixed-phase: a high volume of slushy, partially frozen particles
– Heavy snow-to-mix transition: large snowflakes and aggregate particles
– Light snowfall: light, fluffy snowfall
– Heavy snowfall: an intense, heavy snowstorm
According to Claire Pettersen, a climate scientist at the University of Michigan and co-author of the study, the implications of UMAP are both immediate and long-term. “In the short term, better forecasting can help people adjust their daily commute or prepare for big events like floods or an ice storm,” she stated. “On longer time scales, it can help predict how snowpack or runoff timing will change fresh water availability for a region.”
The research team aims to make their work accessible to a broader audience, not just experienced scientists. To this end, they have created an interactive online platform where users can explore the data and its implications for everyday weather phenomena. Pettersen emphasized the importance of understanding the nonlinear nature of precipitation processes, which are influenced by numerous factors as rain or snow reaches the surface.
For those interested in further exploring these findings, the complete dataset is available on Deep Blue Data, providing an opportunity for both researchers and weather enthusiasts to engage with this groundbreaking work.