

MIT Researcher Enhances Data Visualization for Accessibility
Data visualization has become an essential tool across various fields, from journalism to scientific research. Yet, for individuals who are blind or have low vision, accessing this information poses significant challenges. Researchers at the Massachusetts Institute of Technology (MIT) are pioneering efforts to make data visualizations more accessible, allowing these individuals to interpret data independently instead of relying solely on descriptive captions.
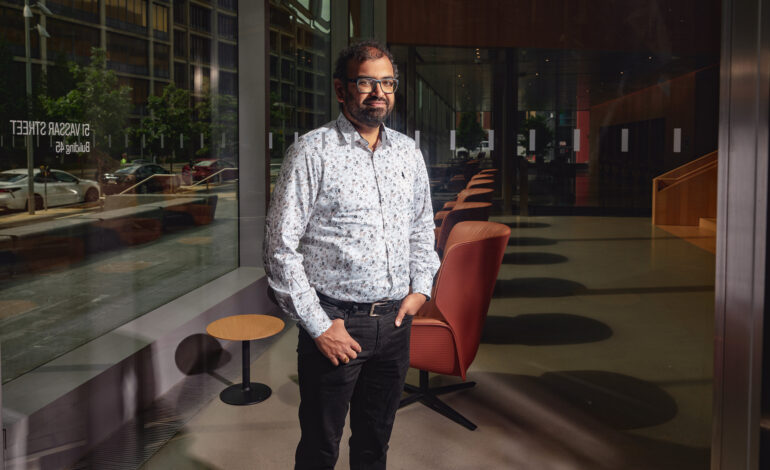
Under the guidance of Arvind Satyanarayan, an associate professor in the Department of Electrical Engineering and Computer Science (EECS) and member of the Computer Science and Artificial Intelligence Laboratory (CSAIL), a team is developing tools that enhance accessibility for screen readers. These devices narrate content displayed on screens, enabling users to explore visualizations through a keyboard interface. Satyanarayan’s hierarchical platform allows users to navigate various levels of detail, from broad overviews to specific data points.
Fostering Human Agency in Data Interpretation
For Satyanarayan, the heart of this initiative is about preserving agency for blind and low-vision individuals. He explains, “Our work in accessibility has been to maintain agency for blind and low-vision people.” Traditional approaches often leave these users without the ability to pose their own questions about the data, instead limiting them to what is conveyed through captions. By providing interactive tools, the team empowers users to engage with the data on their own terms.
The research group also delves into the sociocultural elements surrounding data visualization. As charts and graphs frequently circulate on social media, they can lose context, leading to misinformation. Satyanarayan notes, “Charts can become vectors for misunderstanding, but that is not because they are poorly designed to begin with.” His team is focused on understanding how visualizations can be misinterpreted when shared outside their original environments.
A Journey into Data Visualization
Satyanarayan’s journey into the realm of data visualization began unexpectedly. Growing up in India, Bahrain, and Abu Dhabi, he developed a passion for technology through early experiences with computers. His interest in user interfaces blossomed during his time at the University of California at San Diego, where he took an introductory course in human-computer interaction (HCI). This pivotal moment led him to work in a lab under Jim Hollan, a pioneer in the HCI field.
His academic path continued through a PhD split between Stanford University and the University of Washington, where he explored programming languages and interactive graphical systems. His early projects, including creating a visualization interface for journalists, provided a foundation for his thesis and highlighted the importance of accessibility in data storytelling.
After completing his PhD, Satyanarayan faced a rigorous job search, interviewing with numerous institutions before arriving at MIT. He recalls, “The first day of my interview at MIT was filled with some of the best conversations I had.” This collaborative environment has since influenced the composition of his research group, which includes interdisciplinary students from various fields, including anthropology and social sciences.
The group’s research extends to tactile graphics, which aim to enhance the experience of blind and low-vision individuals in museums and other public spaces. Satyanarayan emphasizes the importance of co-designing tools with blind users to ensure their efficacy. Collaborating with researchers like Daniel Hajas from the University College of London has been instrumental in shaping their approach.
As part of his commitment to social responsibility, Satyanarayan co-teaches an interactive data visualization course at MIT, focusing on pressing social issues such as the housing affordability crisis in the Boston area. Students not only acquire technical skills but also engage in projects that have a tangible impact on their communities. He states, “I love teaching. Our students are so intellectually curious and committed.”
Outside of academia, Satyanarayan enjoys running along the Charles River Esplanade in Boston and has a passion for cooking. He shares a vibrant home life with his wife, a microbiologist, and their new puppy, Fen, symbolizing a fresh chapter as he recently earned tenure.
Looking ahead, Satyanarayan is eager to explore the potential of generative AI in data visualization. He poses a critical question for the future: “How do we ensure that we haven’t lost the parts of the work we find most interesting?” His work continues to redefine the intersection of technology and human experience, striving for a future where data is truly accessible to all.