

Streamline Data Analysis with LabPlot: A Powerful Tool for Researchers
Researchers and data analysts now have a robust tool at their disposal for managing and analyzing vast amounts of data—LabPlot. This software provides a streamlined interface that goes beyond traditional spreadsheets, offering advanced features tailored for complex data processing.
LabPlot empowers users to tackle extensive datasets effectively. It includes sophisticated object management capabilities and worksheets akin to those found in Jupyter notebooks. For those who require additional customization, the software development kit allows users to extend functionality according to their specific needs.
Advanced Features and Functionalities
One of LabPlot’s standout features is its ability to handle various output formats. Users can create standard visualizations such as line plots and histograms, as well as more specialized graphical representations like Q-Q plots. The program supports hierarchical spreadsheet structures, enabling a child spreadsheet to compute statistics based on data from a parent spreadsheet.
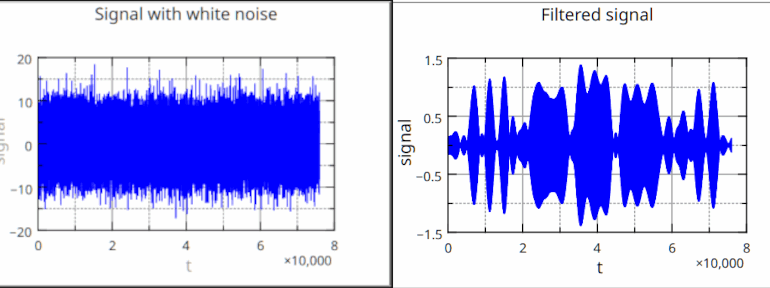
In addition, LabPlot comes equipped with numerous tools for regression analysis, likelihood estimation, numerical integration, and differentiation. For users working with signal data, the software includes Fourier transform capabilities and filters. The program’s effectiveness is illustrated in its ability to extract meaningful signals from noise using advanced signal processing techniques.
LabPlot also integrates seamlessly with other programming environments. It serves as a front end for popular languages such as Python, Julia, Scilab, and Octave. Furthermore, it can read Jupyter projects, making it a flexible option for users familiar with different platforms.
Accessibility and User Engagement
The software is compatible with multiple operating systems, including Windows, Mac, Linux, FreeBSD, and Haiku. Users can download LabPlot directly from its official website and explore its capabilities first-hand.
For those interested in gaining a deeper understanding of the software, numerous instructional videos are available on its YouTube channel. These resources provide insights into its various features and practical applications, making it easier for new users to familiarize themselves with the interface.
LabPlot presents a compelling alternative for professionals who have relied solely on spreadsheets for data analysis. While traditional spreadsheets can manage data efficiently, they may not provide the same level of sophistication required for processing complex signals and large datasets. LabPlot’s extensive feature set and user-friendly design make it a valuable asset for researchers and data analysts alike.
In summary, LabPlot stands out as an impressive software solution designed for those who need to analyze and present large quantities of data effectively. With its comprehensive tools and capabilities, it offers a modern approach to data visualization and analysis, ensuring that users can extract meaningful insights from their datasets.